ETF inflows broke last year’s record before year-end
The key margin is $1.54 trillion - $1.49 trillion = $0.05 trillion; $0.05 trillion / $1.49 trillion = 3.4%.
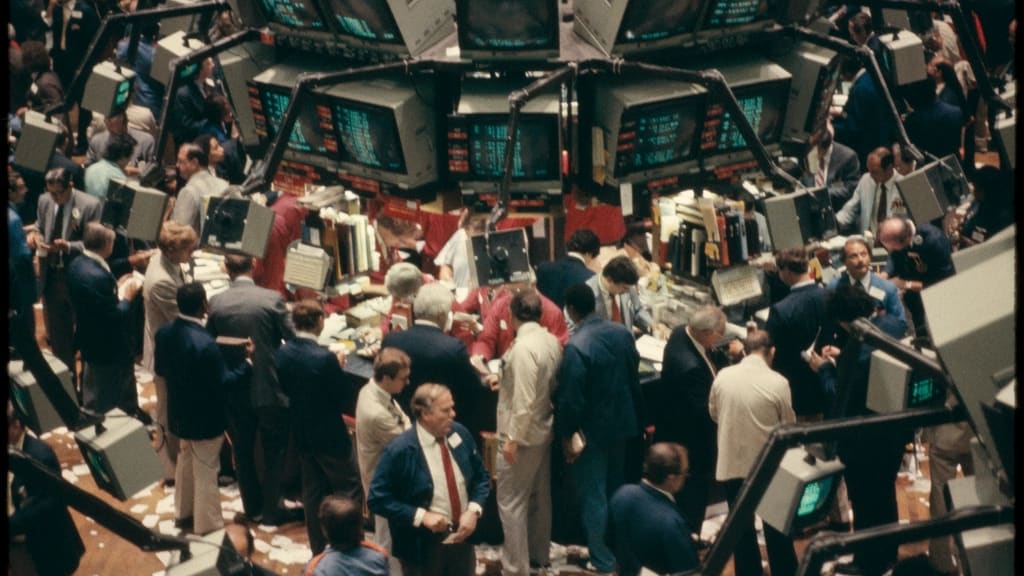
ETF flows have moved from strong to record-setting, and the useful point is not that investors are suddenly smarter. It is that the ETF wrapper is absorbing a larger share of ordinary asset allocation. The number carrying the story is 3.4%: $1.54 trillion of inflows reported for U.S.-listed ETFs this year minus $1.49 trillion for last year’s full-year record equals $0.05 trillion, and $0.05 trillion divided by $1.49 trillion equals 0.0336, rounded to 3.4%. That is not a return forecast. It is a market-structure number. It says ETFs have already beaten the prior annual flow record before the year is finished.
The latest weekly tape supports the same reading. ICI’s weekly table shows 53,376 million dollars of estimated net ETF issuance; 53,376 million divided by 1,000 equals $53.376 billion, which rounds to the $53.38 billion public release figure. A flow week of that size does not tell anyone what to buy. It does say that the low-cost, intraday-traded fund wrapper is still taking share from older vehicles and from single-security implementation.
Context
ETF.com, citing Bloomberg data, put September ETF inflows at $150.6 billion and year-to-date inflows at $1.54 trillion. The September contribution was $150.6 billion divided by $1,540 billion, which equals 0.0978, or 9.8% of the year-to-date total. ICI’s public FAQ cross-checks the prior record at a rounded $1.5 trillion. The difference between ETF.com’s $1.49 trillion and ICI’s rounded $1.5 trillion is $1.50 trillion minus $1.49 trillion, or $0.01 trillion, a normal rounding gap rather than a contradictory story.
The asset base is large enough that even big weekly flows are incremental rather than explosive. ICI’s latest monthly ETF asset table shows 16,275.0 billion dollars of ETF assets; 16,275.0 billion divided by 1,000 equals $16.275 trillion. The weekly net issuance of $53.376 billion divided by $16,275.0 billion equals 0.00328, or 0.328% of ETF assets. That is a heavy week in dollar terms, but it is still less than one percent of the base because 0.328% is below 1.000% by 0.672 percentage point.
This distinction matters. A $53.376 billion week can sound like a rush. Against a $16.275 trillion industry, it is better understood as steady institutionalization. The ETF market is no longer a side pocket for tactical traders. It is the operating system through which many investors buy broad indexes, bond exposure, sectors, commodities, and cash-like instruments.
The analysis
The ICI category arithmetic shows where the money went. Equity ETF issuance was $32.475 billion because domestic equity ETFs took in $24.230 billion and world equity ETFs took in $8.245 billion; $24.230 billion plus $8.245 billion equals $32.475 billion. Equity’s share of total weekly issuance was $32.475 billion divided by $53.376 billion, which equals 0.6084, or 60.8%.
Bond ETF issuance was $20.508 billion because taxable bond ETFs took in $14.520 billion and municipal bond ETFs took in $5.988 billion; $14.520 billion plus $5.988 billion equals $20.508 billion. Bond’s share of total weekly issuance was $20.508 billion divided by $53.376 billion, which equals 0.3842, or 38.4%. Hybrid ETFs added $0.817 billion, and $0.817 billion divided by $53.376 billion equals 0.0153, or 1.5%. Commodity ETFs had negative net issuance of $0.424 billion, and negative $0.424 billion divided by $53.376 billion equals negative 0.0079, or negative 0.8%.
The mix is the story. Equity plus bond issuance was $32.475 billion plus $20.508 billion, or $52.983 billion. That $52.983 billion divided by total issuance of $53.376 billion equals 0.9926, or 99.3%. In plain terms, almost all of the latest ETF creation was in the core equity-and-bond lanes, not in a narrow theme. That makes the flow record more about portfolio plumbing than speculation.
The acceleration is also visible. The prior weekly total was $39.852 billion. The latest weekly total of $53.376 billion minus $39.852 billion equals $13.524 billion. Divide $13.524 billion by $39.852 billion and the week-over-week increase is 0.3394, or 33.9%. For a broader check, the latest five weekly totals were $53.376 billion, $39.852 billion, $27.266 billion, $11.398 billion, and $33.240 billion. Their sum is $165.132 billion, and $165.132 billion divided by five equals an average of $33.026 billion. The latest $53.376 billion week was $20.350 billion above that average because $53.376 billion minus $33.026 billion equals $20.350 billion; $20.350 billion divided by $33.026 billion equals 0.6162, or 61.6% above the five-week average.
Expense ratios are where the flow story becomes a household math problem. The SEC describes fund operating expenses as percentages of assets, meaning the fee is paid indirectly from the fund. Using the SEC fee examples of 0.25% and 1.00%, a $10,000 holding at 0.25% costs $10,000 multiplied by 0.0025, or $25 per year before compounding. The same $10,000 at 1.00% costs $10,000 multiplied by 0.0100, or $100 per year before compounding. The annual gap is $100 minus $25, or $75. In percentage-point terms, 1.00% minus 0.25% equals 0.75 percentage point, and 0.75 multiplied by 100 equals 75 basis points.
That fee math is why scale matters. Larger ETF markets tend to invite more fee competition, more index replication choices, and more precise exposures. But the investor still has to check whether a cheaper fund owns the same basket, tracks the same index, trades with reasonable spreads, and fits the same tax account. The lowest expense ratio is useful only if the exposure is actually the exposure needed.
Risks and counterpoints
The main risk is revision. ICI says weekly ETF issuance is estimated, while actual monthly issuance can differ after data collection. If the latest $53.376 billion estimate were revised down by the full $13.524 billion week-over-week increase, the adjusted figure would be $53.376 billion minus $13.524 billion, or $39.852 billion, and the acceleration argument would disappear because $39.852 billion minus $39.852 billion equals $0.000 billion.
The record-margin claim has a separate break point. The conclusion depends on the $1.54 trillion year-to-date flow figure staying above the $1.49 trillion prior record. If the $1.54 trillion estimate were revised down by more than $0.05 trillion, then $1.54 trillion minus $0.05 trillion would equal $1.49 trillion, and the 3.4% record margin would be gone.
There is also a conversion caveat. Some ETF flow reflects mutual funds becoming ETFs, not fresh investor saving. ICI’s historical conversion figure was $113 billion of assets converted against $4,800 billion of ETF net issuance over its measured window; $113 billion divided by $4,800 billion equals 0.0235, or 2.4%. That is small in the historical data, but if conversions became much larger, ETF inflows would overstate organic demand.
The assumption that would take the conclusion down is simple: net issuance must remain a reasonable proxy for investor demand. If accounting mechanics, conversions, or temporary quarter-end trades dominate the data, then the wrapper-share thesis is weaker.
What to do with it
Treat the ETF flow record as a prompt for portfolio hygiene, not a signal to chase what just gathered assets. The practical questions are dull and important: what index is being tracked, what risks are concentrated, what fee is being paid, what spread is being crossed, and whether the fund overlaps with positions already owned.
For broad index exposure, the expense ratio is a hurdle that repeats. A 0.25% fund on $10,000 costs $25 per year because $10,000 multiplied by 0.0025 equals $25. A 1.00% fund on the same $10,000 costs $100 per year because $10,000 multiplied by 0.0100 equals $100. That $75 annual difference does not decide suitability by itself, but it is a known drag before any market risk is taken.
For sector ETFs, the question is different. A sector fund can be cheap and still be a concentrated macro bet. The right comparison is not only fee versus fee; it is exposure versus exposure. Record ETF demand makes implementation easier, but it does not remove equity risk, duration risk, credit risk, commodity risk, tracking error, tax drag, or the risk of buying a narrow basket after the narrative is already crowded.
Sources
Disclaimer. This is editorial analysis, not investment advice. No security mentioned here is an offer to buy or sell. Past performance does not guarantee future results — decide based on your own situation, time horizon and risk tolerance.

BlackMoney Desk
ETFs & FundsWrites for BlackMoney. Open math, named risks, no hot tips.
Comments
0 commentsNo comments yet. Yours could be the first.