ETF inflows at $1.52T + $0.02T = $1.54T make fees scale
U.S. ETF inflows cleared State Street's prior $1.52T record by $0.02T, so $1.52T + $0.02T = $1.54T. One basis point on that base is $154M a year because $1.54T x 0.0001 = $154M.
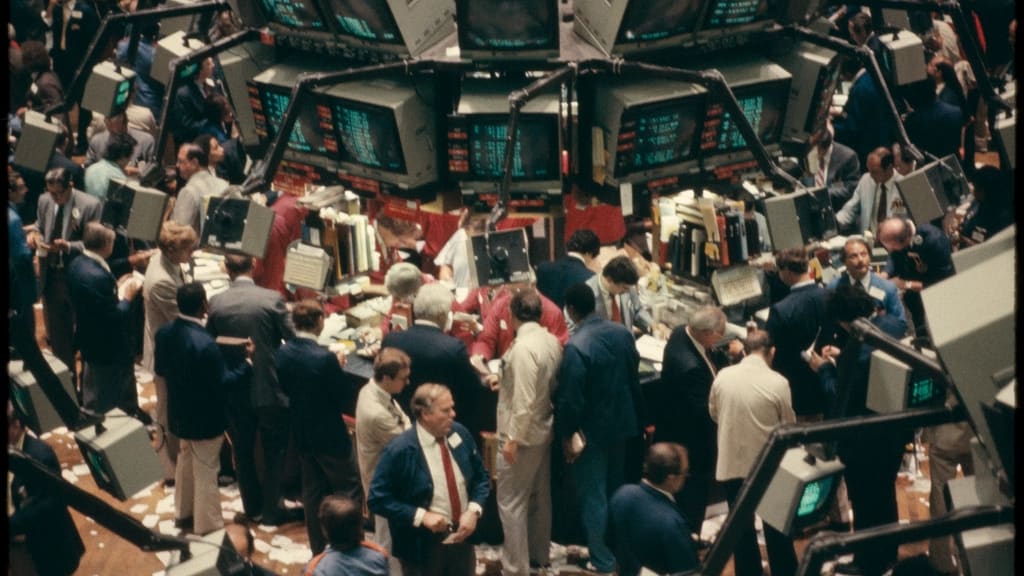
The ETF story of the last few days is not a single fund launch or a tactical rotation. It is the scale of the wrapper itself. State Street put U.S.-listed ETF inflows through September at $1.54 trillion, which was $0.02 trillion above its prior $1.52 trillion annual record; the open math is $1.52 trillion + $0.02 trillion = $1.54 trillion. In dollars, that record margin is $20 billion because $0.02 trillion x $1,000 billion per trillion = $20 billion. In percentage terms, the margin over the old record is 1.3%, calculated as $20 billion / $1,520 billion = 0.0132 = 1.3%. The investment point is not that ETF buyers are automatically right. It is that fund costs, structure, and concentration now operate on a base large enough for tiny percentages to become large dollar amounts.
Context
The public data lined up around the same basic conclusion. ETF.com, using Bloomberg data, reported $150.6 billion of September ETF inflows and $1.54 trillion of year-to-date inflows. September alone was 9.8% of the year-to-date total, calculated as $150.6 billion / $1,540 billion = 0.0978 = 9.8%. State Street reported a September total near the same level, with the record arithmetic above. iShares described U.S.-listed ETFs as having gathered more than $1.5 trillion through September, which is consistent with the State Street and ETF.com figures because $1.54 trillion - $1.50 trillion = $0.04 trillion, or $40 billion of room above the round threshold.
The flow did not stop at quarter-end. ICI's latest weekly estimate showed ETF net issuance of $48.222 billion. That total was the sum of $21.175 billion of equity ETF issuance, $25.412 billion of bond ETF issuance, $0.335 billion of hybrid ETF issuance, and $1.300 billion of commodity ETF issuance; $21.175 billion + $25.412 billion + $0.335 billion + $1.300 billion = $48.222 billion. The bond share of that week was 52.7%, calculated as $25.412 billion / $48.222 billion = 0.527 = 52.7%. The equity share was 43.9%, calculated as $21.175 billion / $48.222 billion = 0.439 = 43.9%. That is not a clean risk-on or risk-off message. It is a sign that the ETF wrapper is being used across asset classes at once.
J.P. Morgan's monitor also put September ETF flows above $154 billion and U.S. ETF assets at $16.3 trillion. Using the stated floor for flows, the monthly flow rate was 0.94% of assets, calculated as $154 billion / $16,300 billion = 0.0094 = 0.94%. A market that can add roughly 1% of its asset base in a month is not a side pocket anymore. It is a major channel for allocation, rebalancing, tax management, and, increasingly, product design.
The analysis
The cleanest way to read the record is through expense-ratio math. A basis point is 0.01 percentage point, which is 0.0001 in decimal form because 0.01 / 100 = 0.0001. On a $1.54 trillion flow base, a single basis point equals $154 million per year before market movement, because $1,540 billion x 0.0001 = $0.154 billion = $154 million. That is the hidden scale effect. The number looks small in a fact sheet and large in aggregate dollars.
Take a simple fee comparison. A 10-basis-point fund charge is 0.10%, which is 0.0010 in decimal form because 0.10 / 100 = 0.0010. Applied to $1.54 trillion, that is $1.54 billion per year, calculated as $1,540 billion x 0.0010 = $1.54 billion. A 30-basis-point fund charge is 0.30%, which is 0.0030 in decimal form because 0.30 / 100 = 0.0030. Applied to the same base, that is $4.62 billion per year, calculated as $1,540 billion x 0.0030 = $4.62 billion. The difference between those two fee levels is $3.08 billion per year, calculated as $4.62 billion - $1.54 billion = $3.08 billion.
That arithmetic is not saying every dollar of new ETF inflow pays either fee level. It is a scale test. The market has reached a size where a 20-basis-point spread, calculated as 30 basis points - 10 basis points = 20 basis points, can matter more than the marketing language around the product. At the account level, the same math is less dramatic but still real. On $10,000, a 10-basis-point fee costs $10 per year, calculated as $10,000 x 0.0010 = $10. A 30-basis-point fee costs $30 per year, calculated as $10,000 x 0.0030 = $30. The account-level gap is $20 per year, calculated as $30 - $10 = $20.
The record flow also changes how sector ETFs and index funds should be read. Flows into a sector ETF do not prove the sector is cheap, and flows into a broad index fund do not prove the index is diversified. They show demand for a wrapper tied to an exposure. The exposure still has to be opened. A broad index can be dominated by a small group of large companies. A sector ETF can look diversified by holding count while still sharing the same earnings driver, rate sensitivity, or commodity input. A low expense ratio lowers the hurdle, but it does not neutralize valuation, concentration, duration, currency, or liquidity risk.
The latest ICI weekly data reinforce that point. The week was led by bond ETFs, not equity ETFs, with the bond lead equal to $4.237 billion, calculated as $25.412 billion - $21.175 billion = $4.237 billion. That bond lead was 8.8% of the weekly ETF total, calculated as $4.237 billion / $48.222 billion = 0.0879 = 8.8%. In other words, the record ETF year is not simply a story of stock-market enthusiasm. It is also about cash substitutes, duration decisions, municipal demand, and portfolio plumbing.
Risks and counterpoints
The main risk is measurement. ETF flow data are not all produced the same way. State Street, ETF.com, ICI, iShares, and J.P. Morgan use overlapping but not identical datasets, timing, and classifications. If the $1.52 trillion + $0.02 trillion = $1.54 trillion record is revised lower, the conclusion about a record year becomes weaker. The more durable conclusion, that expense ratios scale sharply with assets, would still hold, but the exact dollar examples would move with the asset base.
The second risk is interpretation. Flows are not votes with a single meaning. They can come from model-portfolio rebalances, tax trades, short-term cash management, institutional transitions, or creations tied to market-making demand. If the assumption that flows represent durable investor allocation breaks, then the conclusion that ETF demand reveals investor conviction breaks with it. The fee math also assumes assets stay invested for an annual period. If money enters and leaves quickly, the realized fee dollars are lower than the annualized examples. If asset prices rise after the inflow, fee dollars are higher because expense ratios apply to average net assets.
The counterpoint is that ETF growth can be good for investors when competition lowers fees, transparency improves comparison, and intraday liquidity makes implementation easier. The problem is not the wrapper. The problem is treating the wrapper as the analysis.
What to do with it
The practical response is due diligence, not a trade. Start with the exposure, then price the wrapper. For any ETF, the first question is what the fund owns and how those holdings can lose money. The second question is what the fund charges, including the stated expense ratio, the bid-ask spread, premium or discount behavior, tax profile, securities-lending policy, and whether the strategy relies on derivatives or leverage.
The expense-ratio line deserves more attention now because the base is so large. One basis point on the $1.54 trillion flow base is $154 million per year, calculated as $1,540 billion x 0.0001 = $154 million. That does not tell anyone which fund to buy or sell. It tells the reader what to ask before accepting a fund's label. In a record ETF market, the label may say index, active, sector, income, buffer, or ultra-short. The math still asks the same question: what risk is being bought, what fee is being paid, and which assumption would make the exposure fail?
Sources
Disclaimer. This is editorial analysis, not investment advice. No security mentioned here is an offer to buy or sell. Past performance does not guarantee future results — decide based on your own situation, time horizon and risk tolerance.

BlackMoney Desk
ETFs & FundsWrites for BlackMoney. Open math, named risks, no hot tips.
Comments
0 commentsNo comments yet. Yours could be the first.